What does the land at
Zaytuna Farm say?
We read the terrain of the world's best-known permaculture site the same way we'd read any parcel: from satellite elevation, satellite imagery, and a decade of climate data. No site visit, no inside knowledge. This is an independent analysis of a publicly-known place, offered as a worked example of what a ReadMyLand dossier contains.
A demanding hillside in a benign subtropical climate, with a great deal of water arriving from a very large basin upslope. The costs sit in getting onto the pad and in the fire history rather than in the water: the gentlest route in still reaches 14.9%, which is an engineered driveway rather than a track. It reads strong on climate, workable on water and sun, strategy-led on terrain, watch-level on hazard exposure. Climate scores 82, Excellent; Water 63 and Sun & Growing 62 are workable; Terrain & Building sits at 44: Strategy-led; Fire & Flood Safety 56: Watch.
Curious what your own parcel scores?
Terrain & Building
Across 57 m of elevation range, the parcel carries a largest single building pad of about 20,168 m²: 2.02 hectares of contiguous buildable ground under 7° of slope, enough to host a substantial homestead complex, outbuildings, and parking with room to spare. The largest genuinely level patch on the parcel, under 2°, measures 3,722 m². The gentlest route from the boundary in to the main building pad tops out at a 14.9% approach grade: past the 12% point where an engineered driveway becomes a real cost line rather than an afterthought, though with 365 frost-free days ice and snow never enter the picture. That figure measures the ground inside the boundary; the condition of the public road beyond it is not in this dataset. Wind is modest, an annual mean of 3.5 m/s, so standard structures need no special bracing. Terrain & Building scores 44/100: Strategy-led. The caveats are drainage and the approach rather than the building ground itself: budget A$14,000–A$34,000 for the engineered driveway the 14.9% approach calls for, and plan drainage around any pad sited near the wet ground flagged below.
Water
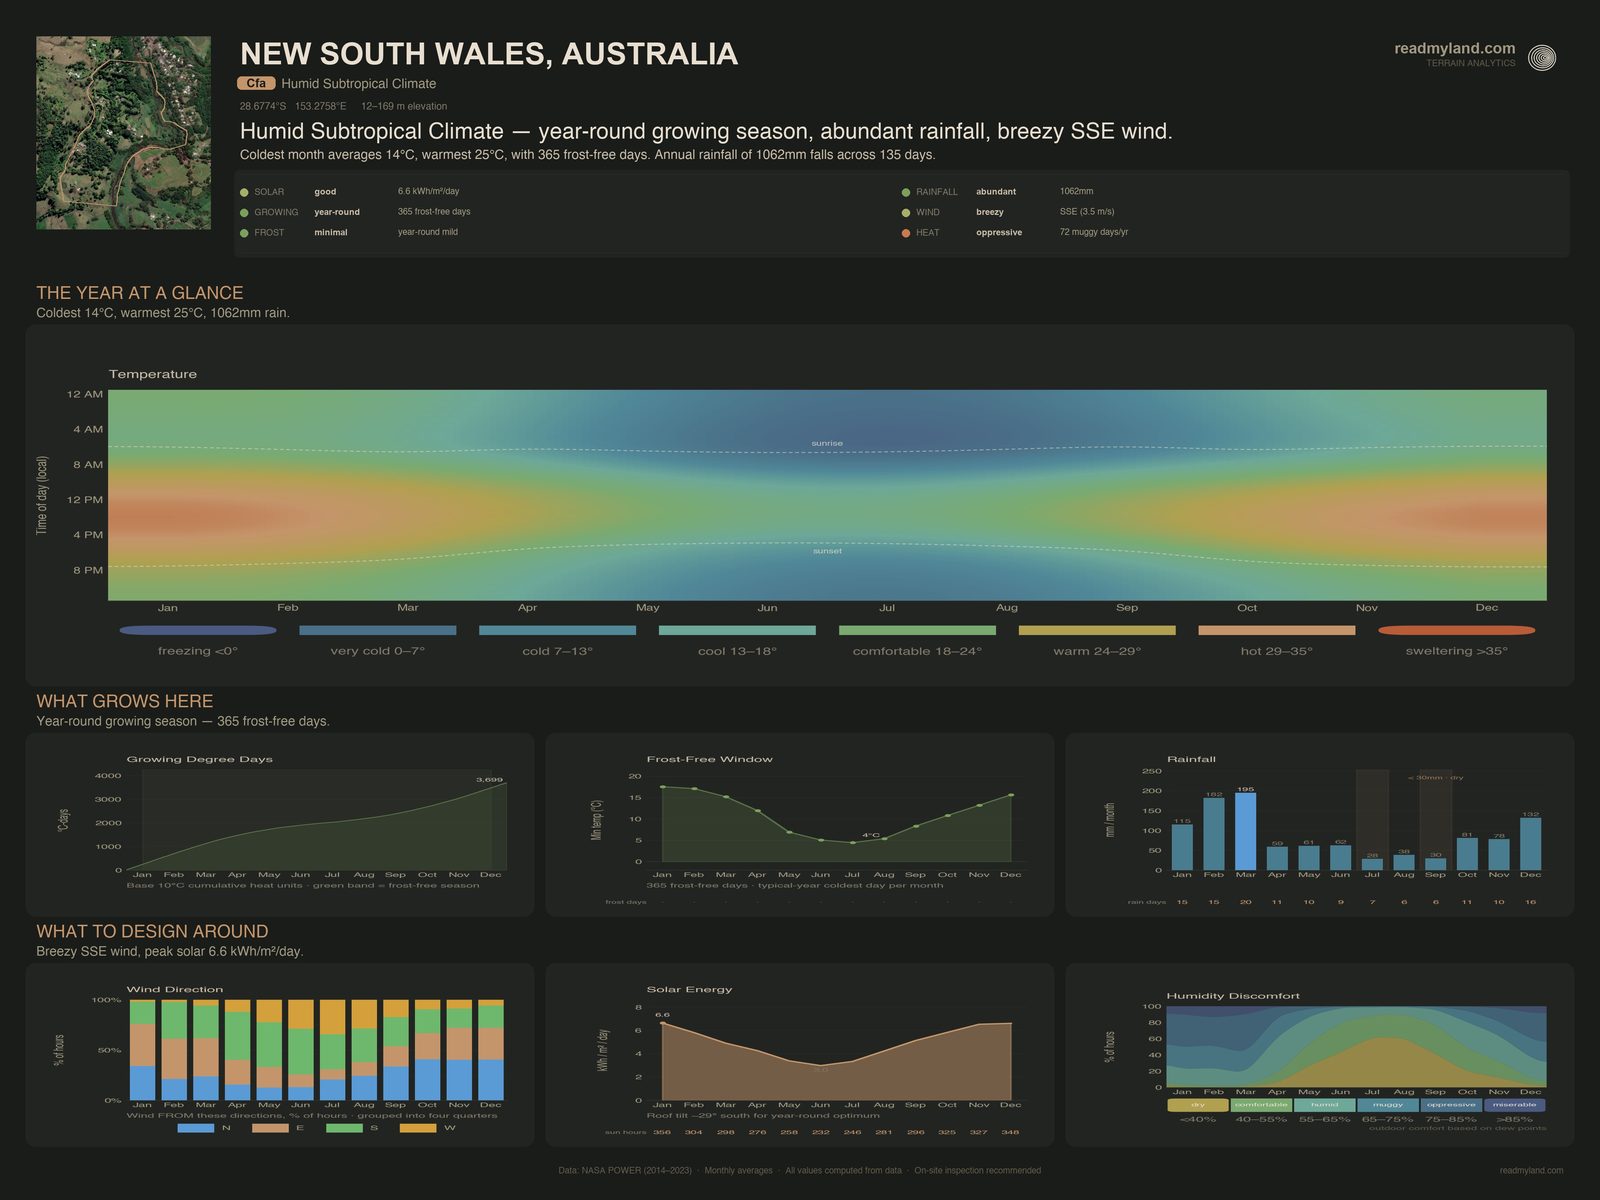
Annual rainfall of 1,062 mm is genuinely abundant, and its timing is kind: March is wettest at 194.9 mm, with February (182 mm) and December (131.9 mm) close behind, so the rain arrives with the subtropical heat rather than against it. Only two months fall below 30 mm, July at 28.3 mm and September at 29.8 mm, and they land either side of August (38.3 mm) in the cool season, when demand is lowest. July is in fact the coolest month of the year here, so this is a mild shoulder, not a summer drought.
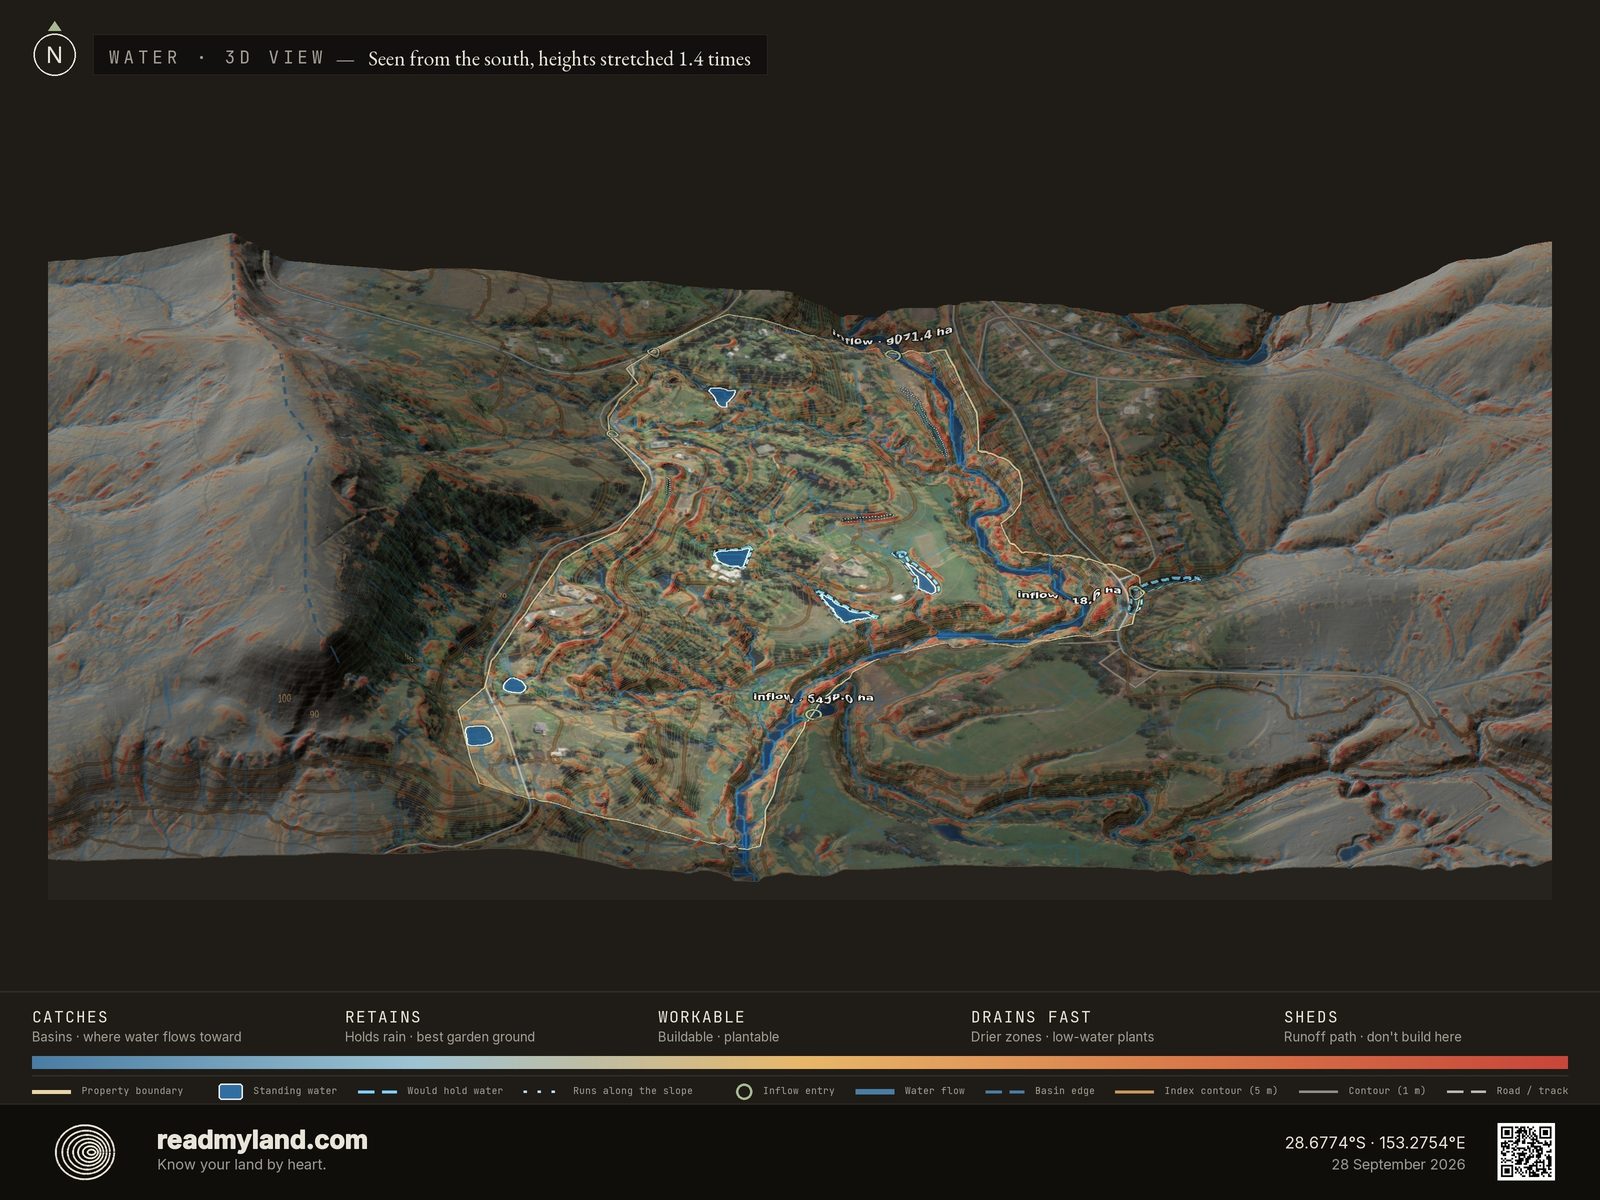
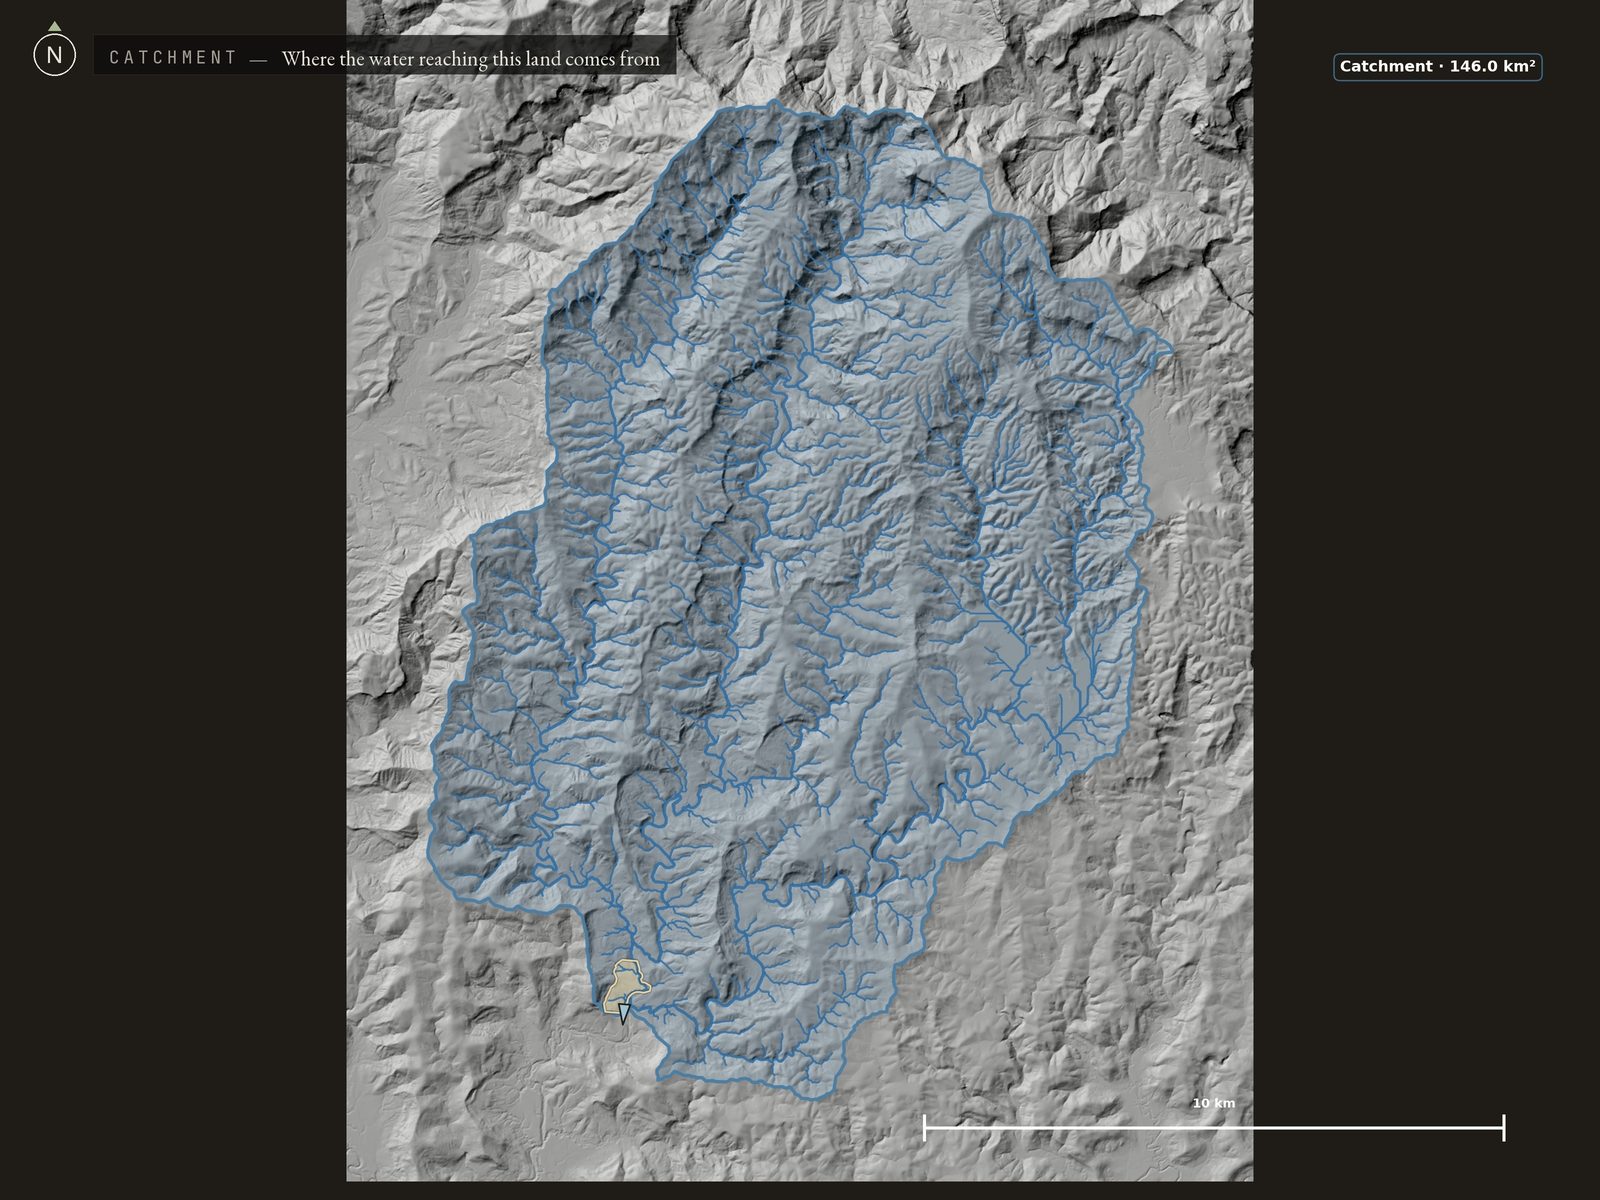
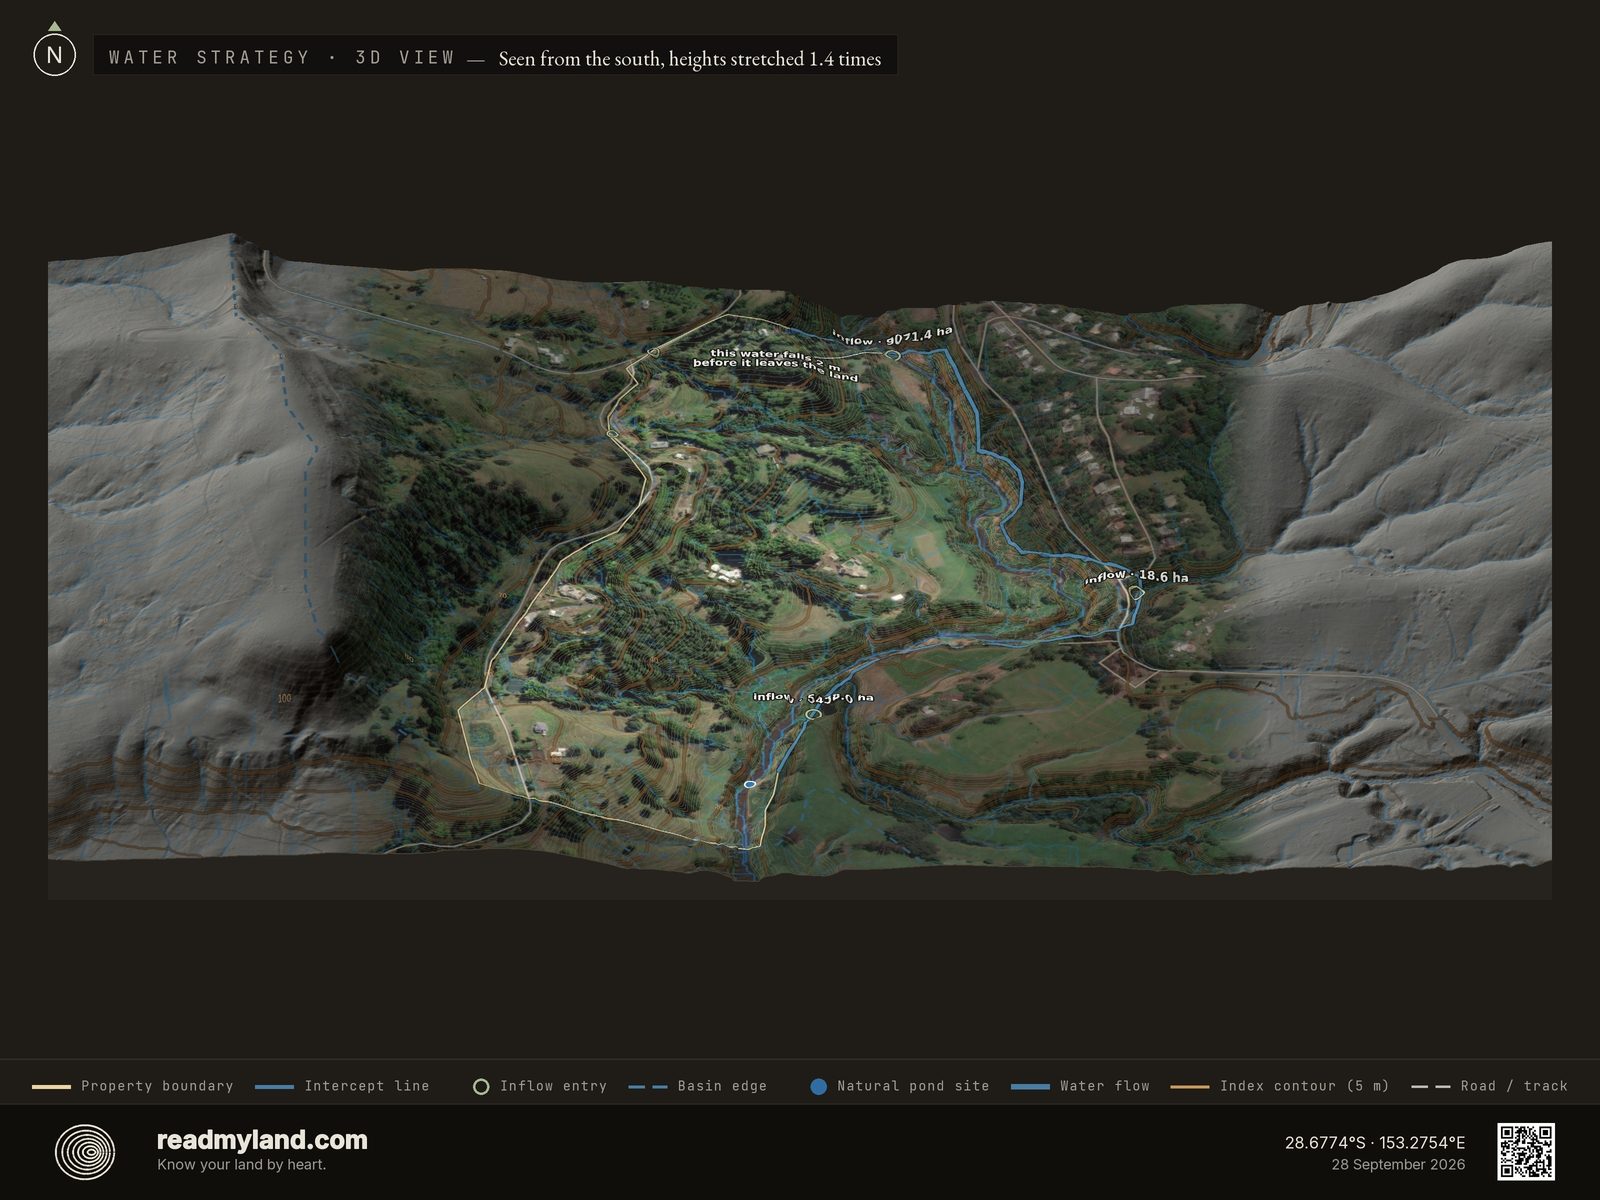
Supply is the striking part. A 14,602.6-hectare basin, 146.0 km², drains through this parcel, and the parcel is only 0.3% of its own catchment, sitting in the lower part of it. Elevation across the basin falls 833 m from its head to this land, against the parcel's own 57 m of relief, and it closes inside the analysis window rather than running off its edge, so 14,602.6 ha is the whole basin and not a floor. The terrain identified one natural pond or dam site: a single place where flow concentrates enough to fill by gravity, so it is worth knowing precisely where. 7.2% of the parcel reads as persistently wet. The pipeline also found the three largest inflow points, boundary stretches where that upslope water actually enters, and those are where a swale, diversion drain, or tank inflow earns its keep. Water scores 63/100: Workable, and the design question is interception and drainage rather than scarcity.
Sun & Growing
Cultivable area is generous: 23.8 hectares, about 60% of the parcel, is workable for crops, pasture, or orchard. Solar resource averages 5.0 kWh/m²/day, solid for both PV and horticulture, but only 43.3% of the parcel carries a sun-favourable aspect: measured across the whole parcel, not across the workable 23.8 hectares. The band it has to fall inside is a generous one: in the southern hemisphere the solar score counts anything from west through north through east, wider than the narrow northerly band the growing score uses, because panels earn their keep at more angles than plants do. Falling outside so wide a band on nearly two-thirds of the parcel is the flat geometry again: ground this level has little tilt in any direction to offer. Concentrate gardens and any tilted PV on the north-facing pockets and let the rest run to pasture and tree crops. With 365 frost-free days and 3,699 growing degree days, the climate supports citrus, avocado, mango, macadamia, banana, and year-round vegetable rotations with no dormancy gap. The soil read comes from the CSIRO Soil and Landscape Grid of Australia at 90 m, a national grid calibrated on Australian survey rather than a global product. It puts surface pH at 5.7 on a balanced loam, which is workable ground: no liming is indicated before cropping. It is still a modelled grid and not a pit, so dig soil pits before committing to orchard blocks.
Climate Context
Temperatures are remarkably stable: the coolest month (July, 13.7°C) and the warmest (January, 24.6°C) span less than 11°C, a southern-hemisphere humid-subtropical climate with no winter dormancy and 365 frost-free days. Plant hardiness is not a planning constraint; frost-sensitive perennials like papaya, citrus, and avocado can hold in the ground without protection. Climate scores 82/100: Excellent, the second-strongest dimension here.
Risk Assessment
Fire. Australia's national fire-history register records no mapped fire in the 100 km² around this parcel, and none touching the parcel itself. That register is Geoscience Australia's Historical Bushfire Boundaries, harmonised to the AFAC national standard, and it labels every entry as either a bushfire or a planned burn. That distinction is the point: an earlier read used satellite burned-area detection, which sees that ground burned and never why, and the three "fires" it reported were dated April and July, the Australian burn-off season rather than the bushfire season. Absence in a register is not a guarantee of safety, and this is subtropical eastern Australia; defensible space around the dwelling remains sound practice. But it is not measurable fire history, and we will not present it as such.
Flood. This is the honest gap. No parcel-scale flood-zone register covers this location: the European samples in this collection carry national flood-zone mapping; this one is read from a global ~1 km inundation model, which resolves large rivers and coastlines but not a farm dam or a creek, plus the terrain itself. The model shows no large-river or coastal flooding here. The terrain has more to say, and at this scale it is the finer instrument: the parcel sits in the lower part of a 14,602.6-hectare basin, 7.2% of it reads high on the topographic wetness index, and the ground is flat enough that surface water ponds rather than leaves. That combination is a reason to commission a local flood-risk assessment before foundations are sited. It is not itself a flood finding, and this dossier raises no flood-zone flag: the wetness figure is a slope-and-flow calculation with no rainfall, soil or time in it, and the global model records no modelled inundation here at any return period. Together, fire and the terrain-derived flood signal score Fire & Flood Safety at 56/100: Watch, the lowest of the five dimensions here and the one thing on this parcel that genuinely needs a specialist before money is committed.
Key Opportunities & Risks
A generous buildable footprint (~20,168 m² under 7°, with a largest genuinely level patch of 3,722 m² under 2° on the parcel) supports almost any structural ambition, though the 14.9% approach grade crosses the 12% threshold where an engineered driveway becomes a budget line rather than an afterthought, and a 365-day frost-free, 3,699-GDD climate that rains when it is hot removes most of the growing risk. Water is a quiet strength here, 63/100, with a large basin arriving and its three largest entry points mapped. Against that: the 14.9% approach needs an engineered driveway (A$14,000–A$34,000), and low-lying ground under a large basin is reason enough to get the local flood read this dataset cannot give. Aggregate flagged site-prep runs A$14,000–A$34,000 on top of the build itself. This analysis is based on satellite and elevation data. It does not assess soil conditions, legal constraints, or factors requiring a site visit. On-site inspection is recommended before purchase or major development.
The layers compute the data; the maps make it readable. Every claim above traces to one of these. Read the note, then the map illustrating it. Ten design maps come with every dossier; the Ruggedness plate, the two catchment plates and the Water Strategy plate below are here because this parcel was read at a fine enough elevation resolution, and had the catchment data and the inflow points, to draw them. This parcel was also read at three different elevation resolutions, 30 m, 5 m and 1 m, with every map compared side by side: what elevation resolution changes.
The land as it actually is
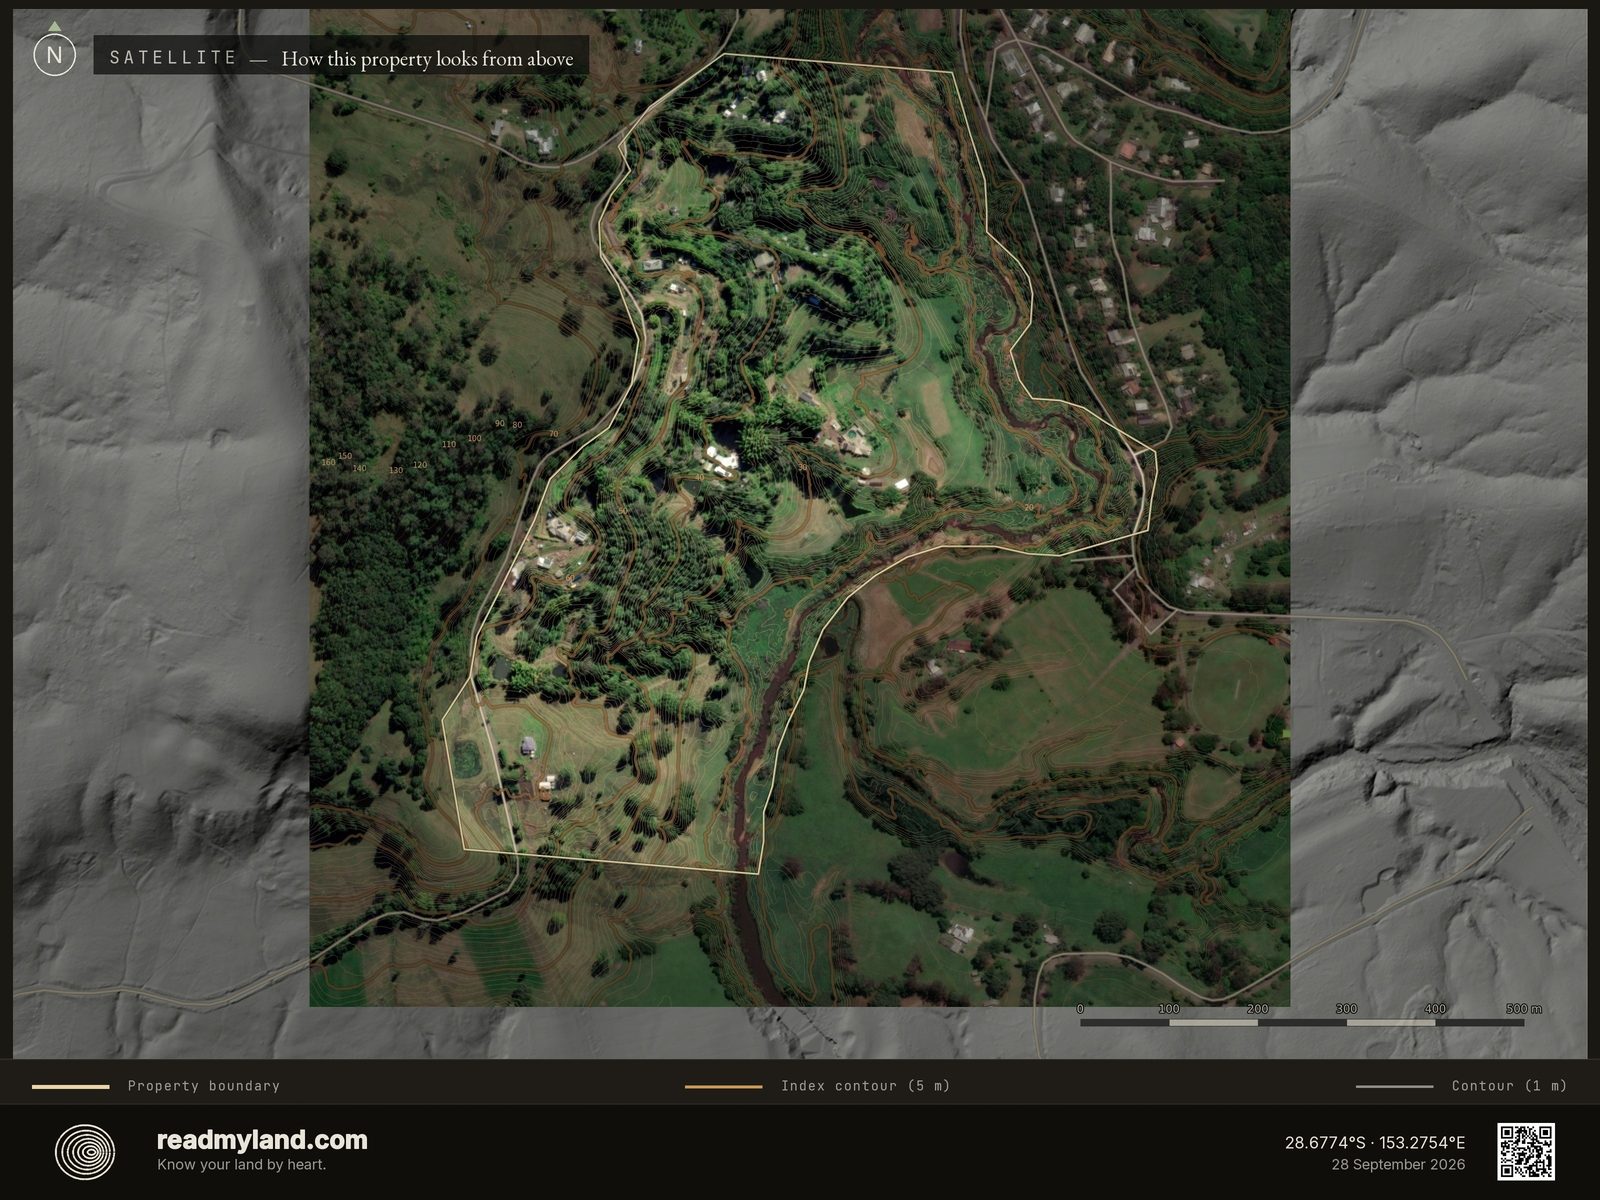
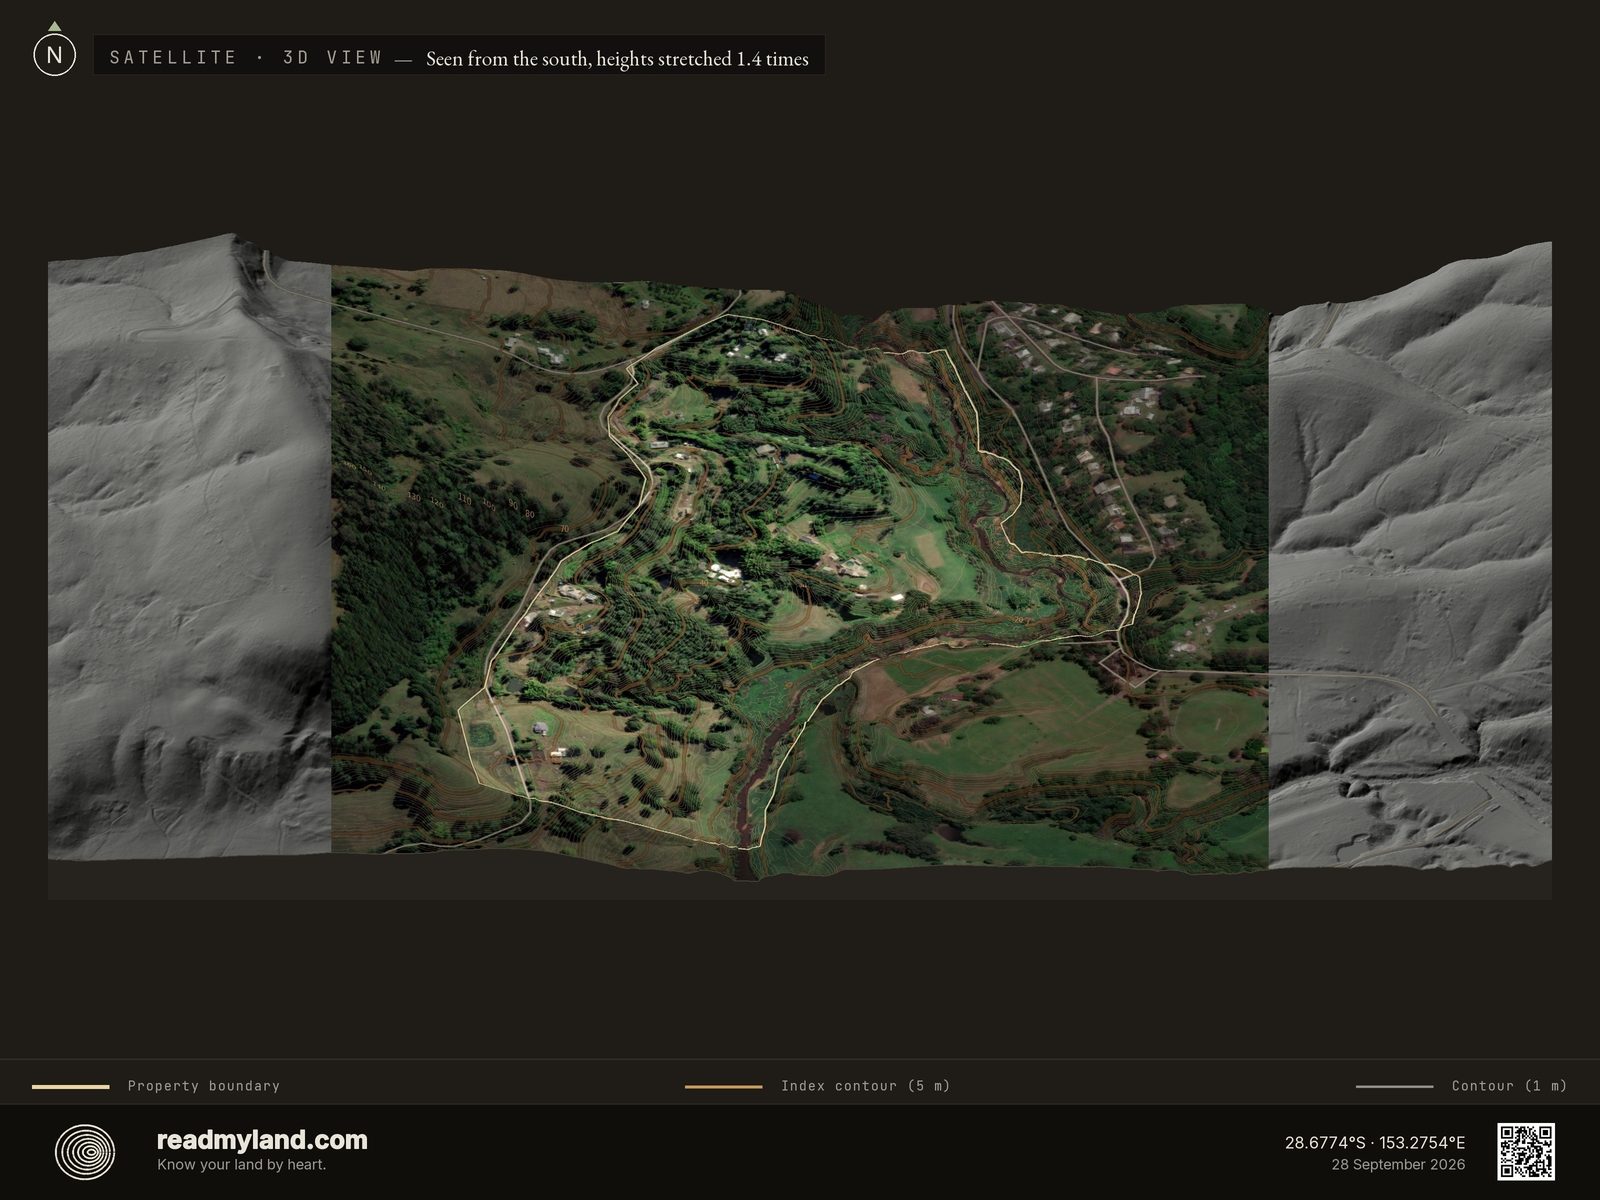
The farm from above, with its boundary and contour lines drawn on. It runs north–south, falling from steep, part-wooded ground on the western boundary, the working buildings strung along its foot, through a mosaic of pasture and food-forest belts into the flat eastern paddocks, where a winding band of riparian trees marks the creek country on the low boundary. Around it the district is the same subtropical green in every direction: on 1,062 mm of rain a year, the question is never whether things grow here, but where the water goes.
Where water collects, where it drains
Blue is where water gathers; orange drains fast and red sheds runoff. The sage rings on the boundary are where upslope water comes in: the parcel's three largest inflow points are labelled with the hectares of ground that feed each, and the small unlabelled rings are the smaller entries. Here 7.2% of the parcel reads as persistently wet: keep foundations and septic out of the blue, and reserve it for wet-tolerant plantings instead.

How much land feeds this one
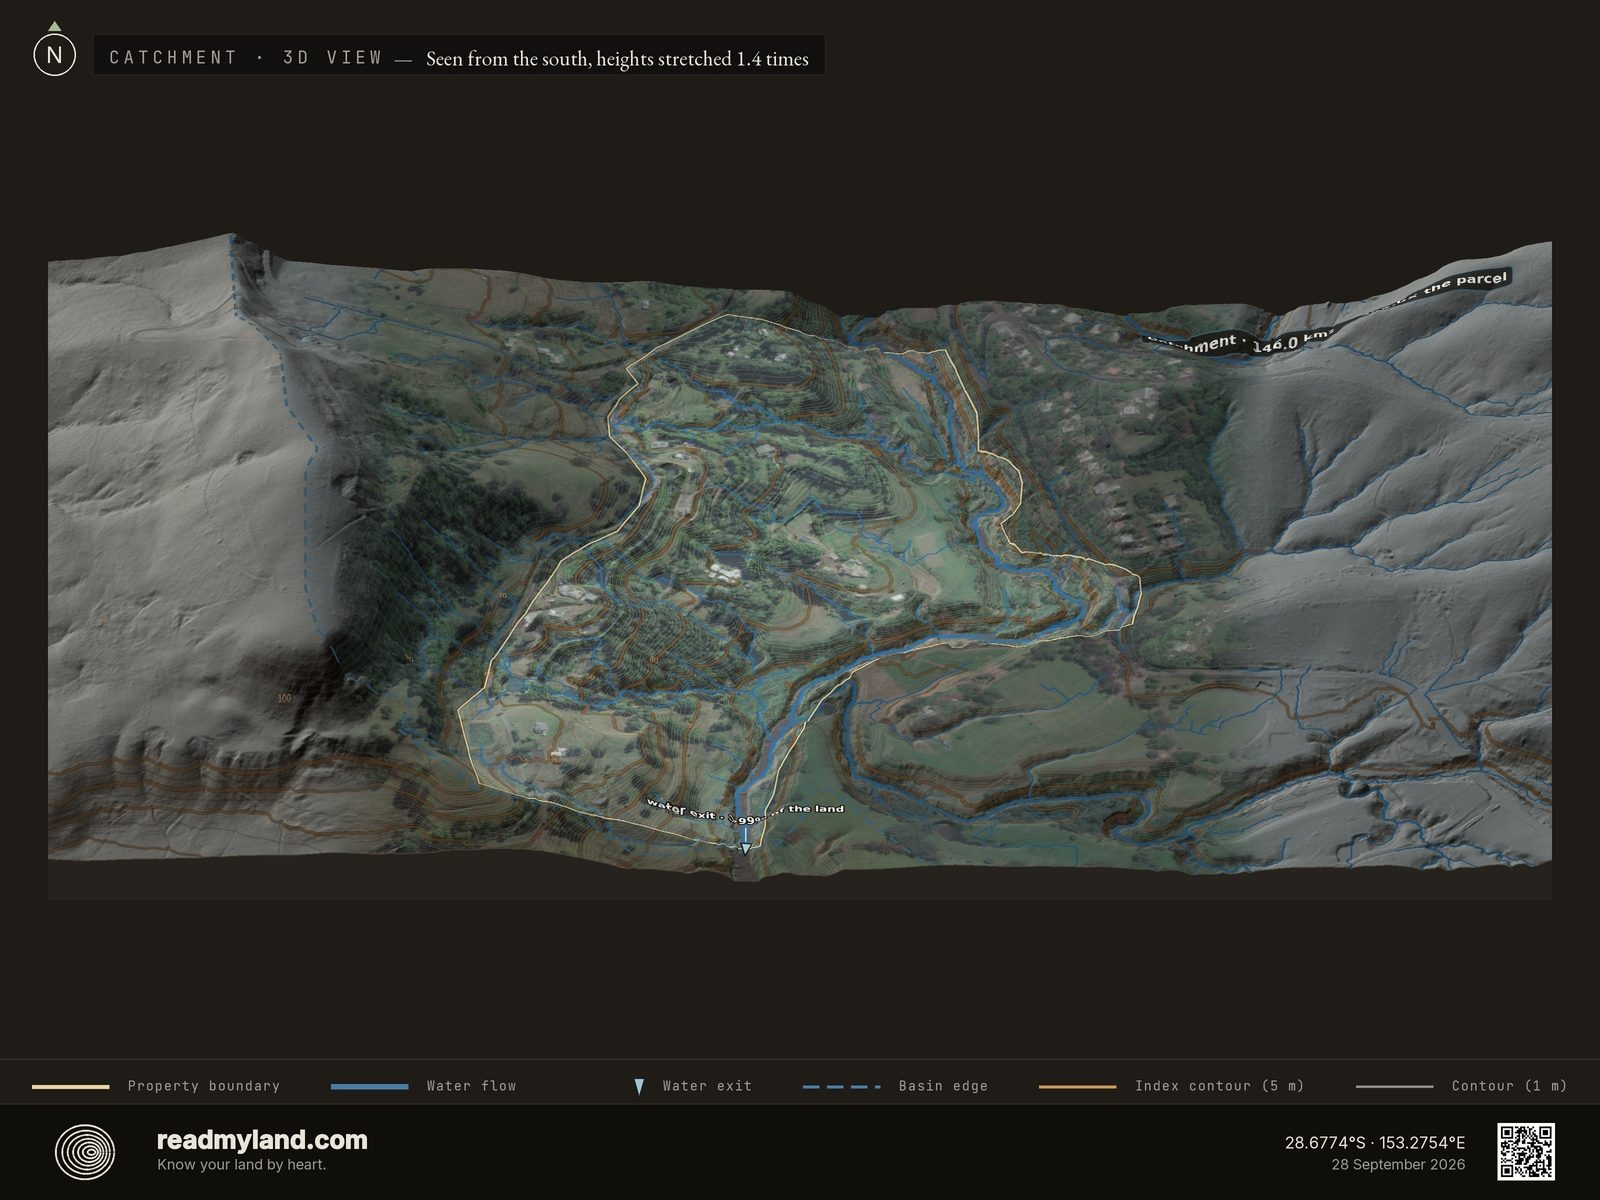
The full upslope basin that drains through the parcel, mapped well beyond the boundary. Here it is vast: 14,602.6 hectares, 146.0 km², of which this parcel is just 0.3%. Elevation across the basin falls 833 m from its head to this land, and the basin closes inside the analysis window rather than running off its edge, so that figure is the whole basin rather than a floor. A great deal of water passes through here after rain. The pale triangle at the parcel's southern tip marks where its own water leaves; the parcel view below labels it with its share.
Where the water actually crosses the line
The same basin zoomed to the property. The parcel sits in the lower part of its catchment, so far more water arrives from the ground above than the land makes itself, and nearly all of the land's own water, more than 99%, leaves at one exit: the pale triangle on the southern tip, labelled with its share. Unlike most parcels, its three largest inflow points are concentrated enough to identify, and they are marked on the wetness and Water Strategy plates: the prime spots for swales and storage. Keep buildings and septic well clear of the heavy blue lines that carry that water across the land.

Intercept it where it arrives
This plate only draws when a parcel has inflow points to draw: most don't. The blue intercept line marks the boundary stretch where upslope water enters, and the sage rings mark the entries themselves, the three largest labelled with the hectares that feed each. Each ring sits in a watercourse, so it shows where to intercept water, not where to put a tank. It matters most on exactly this kind of site: low in a 146.0 km² basin, with just one natural pond site on ground this flat. Catching water at the three largest entries, with a swale, diversion drain, or tank inflow, costs far less than moving it later.

The shape of the ground and the path of the rain
The satellite image again, under contour lines and the blue traces of water flow. The contours stack steadily down the part-wooded western slope, then open wide across the eastern flats. The western tributaries run east off that slope into a trunk line that enters at the north boundary and turns south: the catchment plate marks the water exit on the southern tip. On a farm that catches over a metre of rain a year, these lines are the design brief: slow the water on the slope, or meet it before it leaves.

Terrain shape on its own
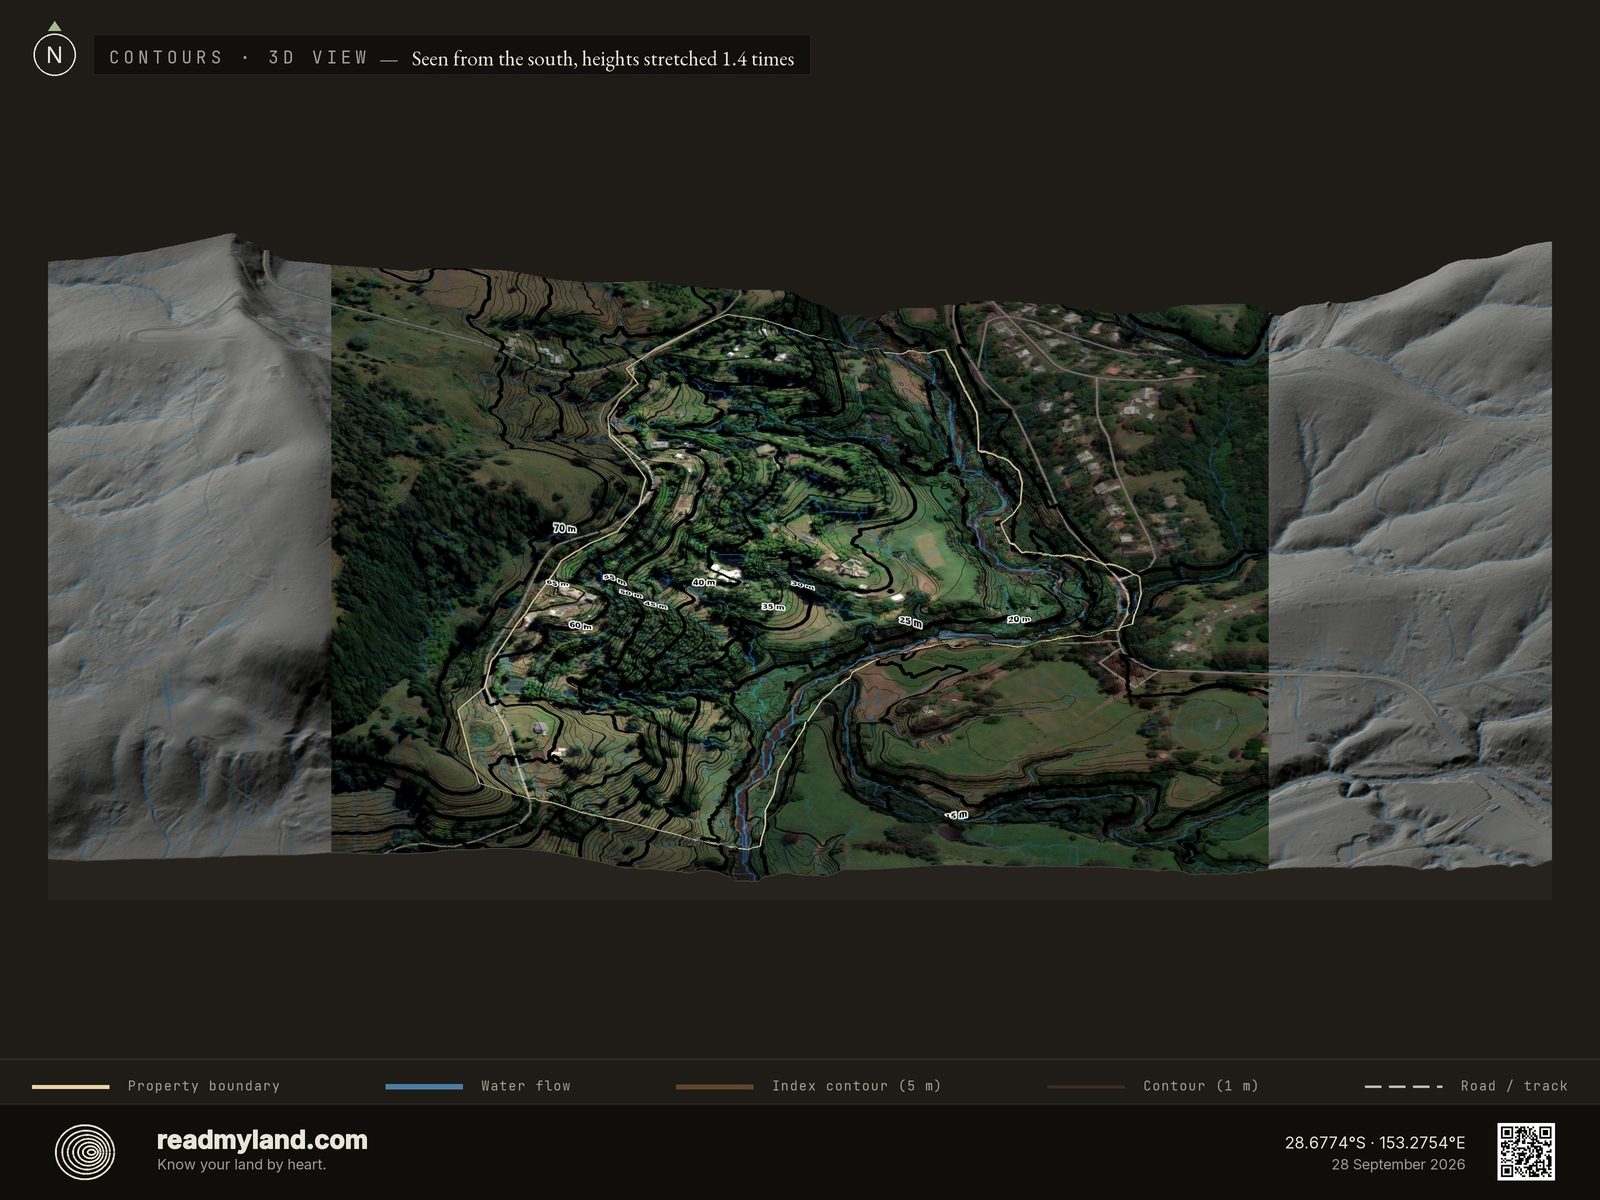
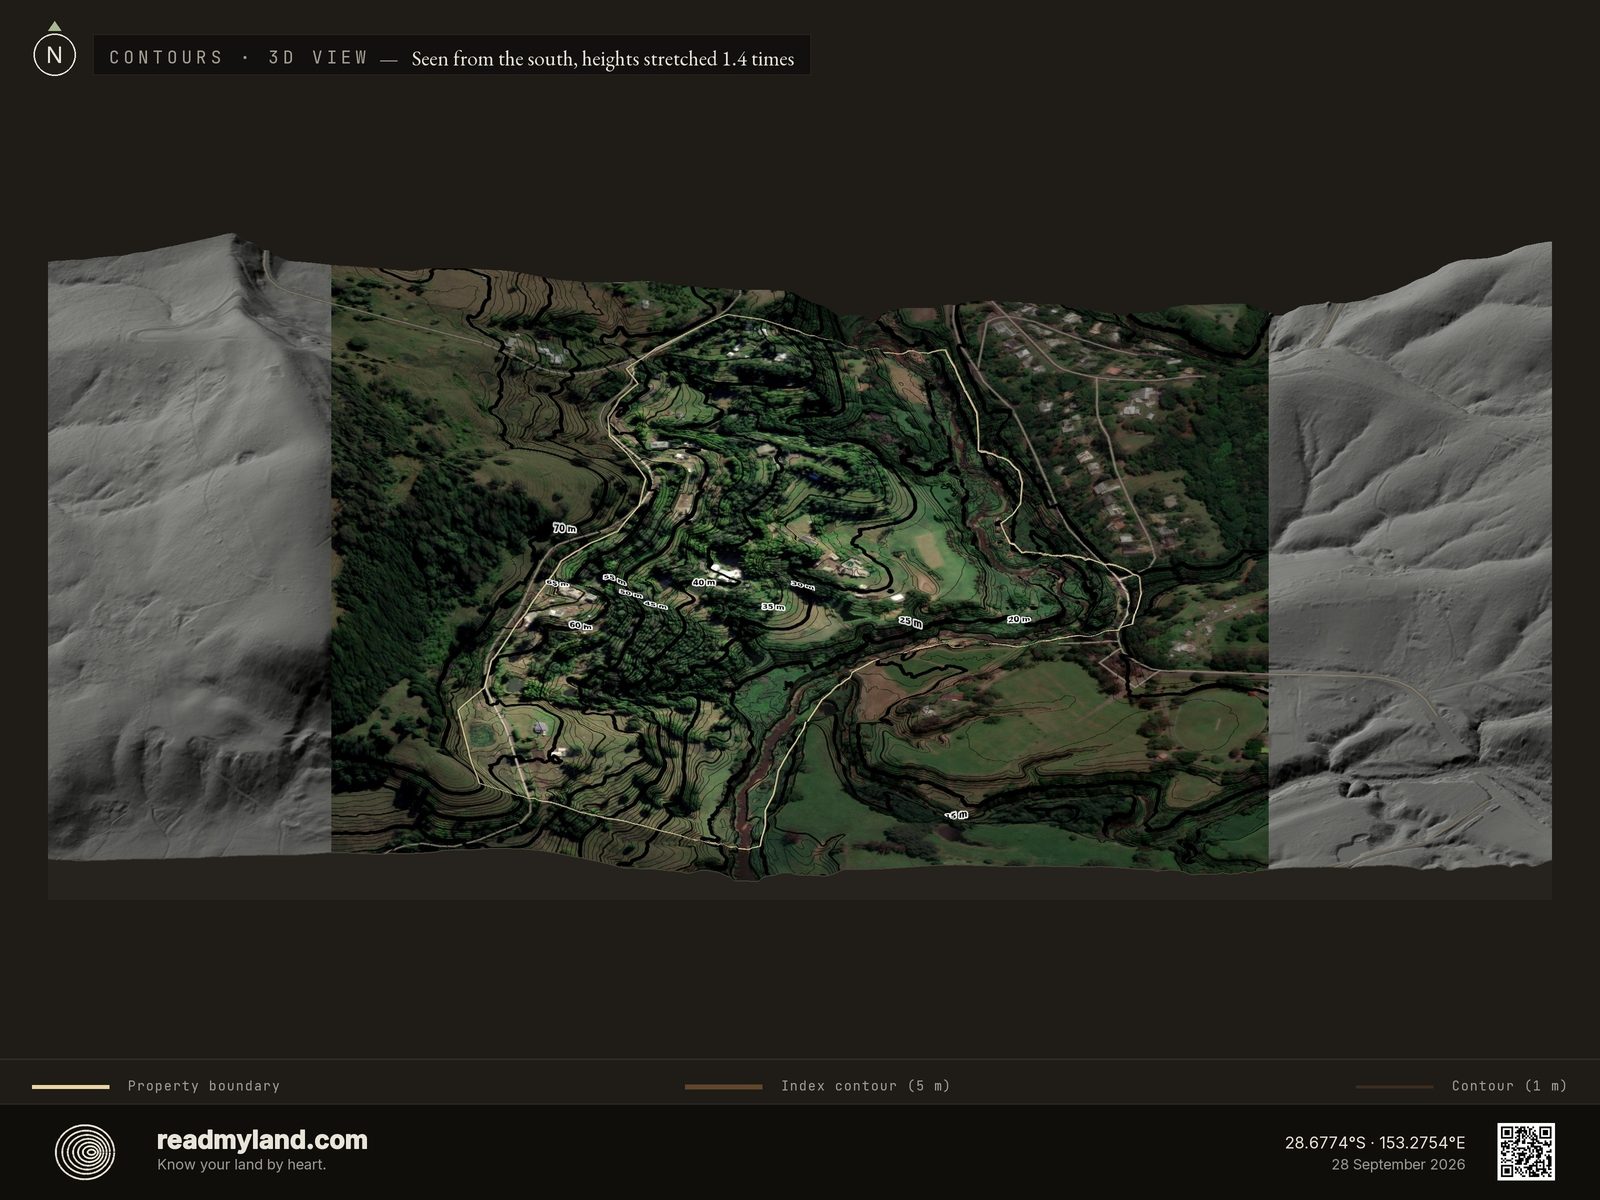
Contours on their own, the water traces removed, and the farm's two halves show plainly: the western slope carries the steepest part of the 57 m range in steady, even steps, while the eastern lobe holds low, its lines widening across the paddocks and wrapping the creek meander, stacking again only where the ground climbs to the eastern boundary. Not a plateau and not a gorge: a workable slope with its own flat delivered at the bottom.

High ground and low pockets
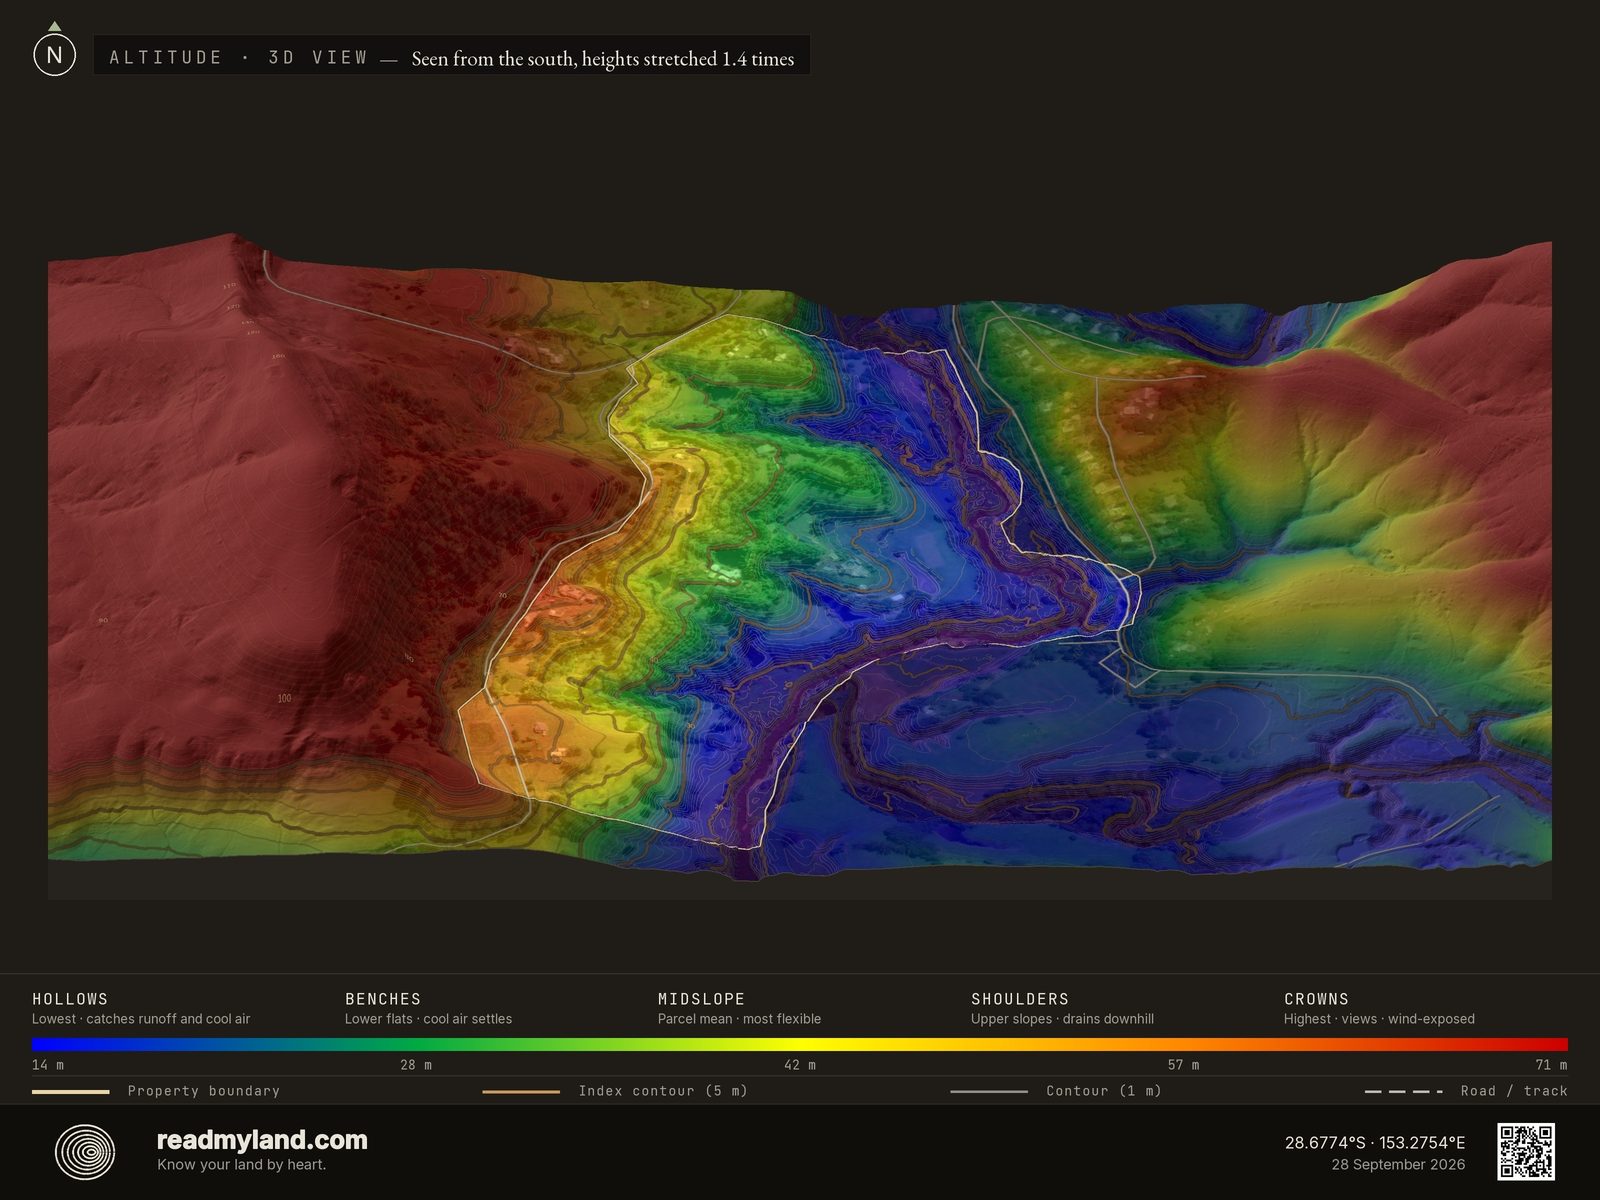
Elevation as a colour gradient from low (blue) to high (red). Low pockets catch runoff and stay damp; higher ground drains well. The full range here is just 57 m: gentle subtropical hill country.

How steep, and how buildable
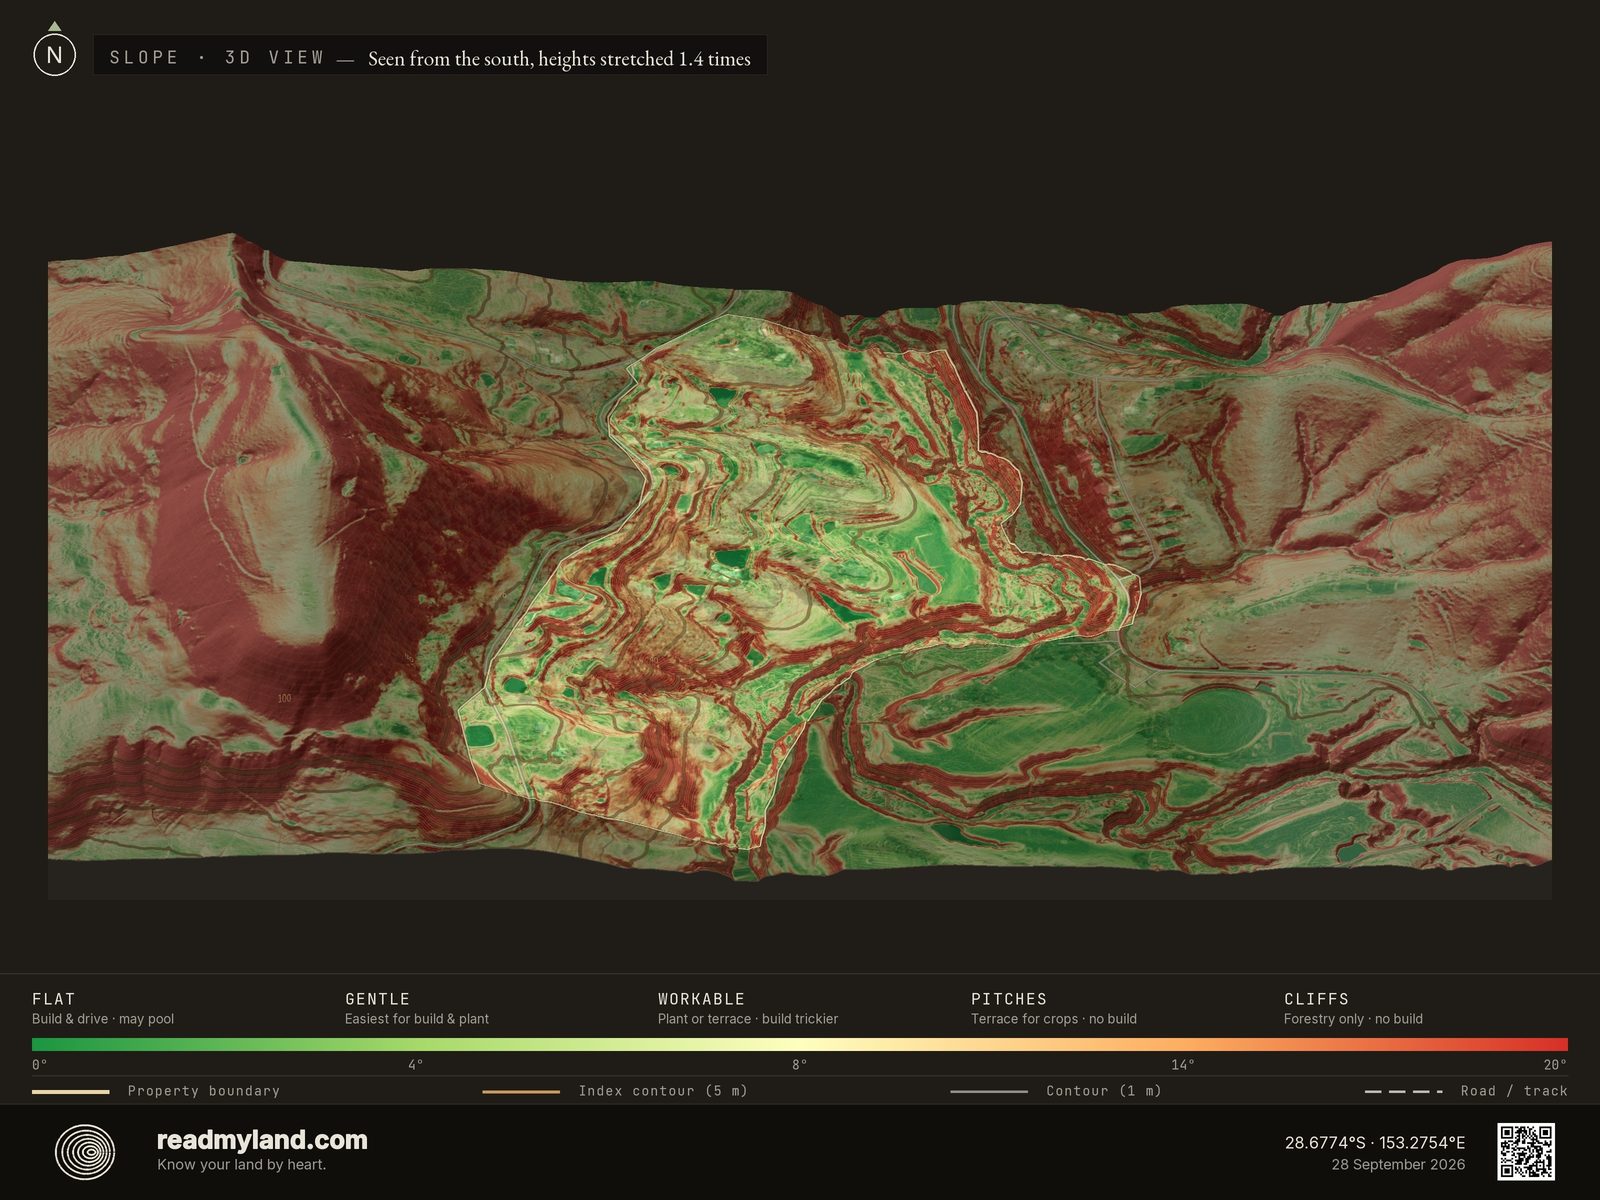
Steepness across the parcel. Flatter ground is easiest to build and cultivate: here 23.8 of the 40 hectares read as cultivable, but the largest contiguous buildable pad is only 2.02 ha and the gentlest route onto it still reaches 14.9% — which is why Terrain & Building scores 44, Strategy-led.

Where the ground breaks, and where it runs smooth
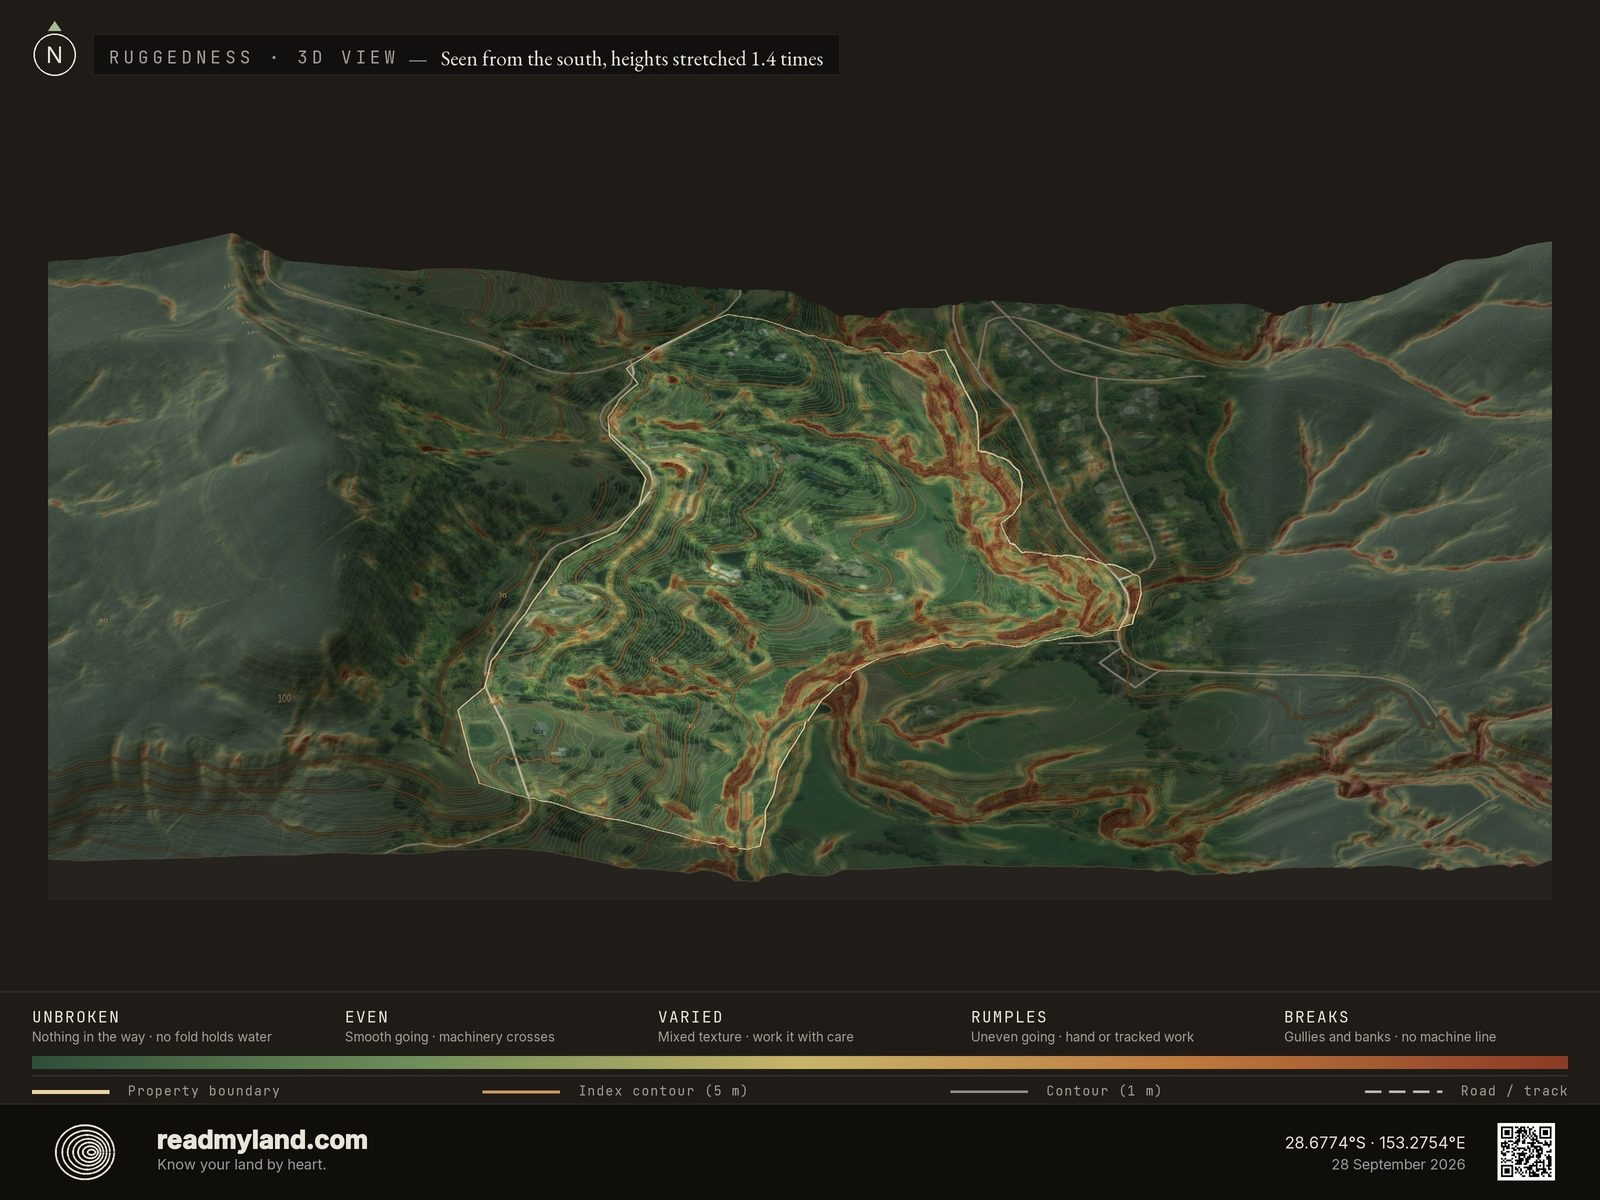
Where the ground surface breaks up rather than how steep it is: gullies, banks, ditches, terrace edges and old track cuttings read in rust, ground that runs smooth reads green. A uniformly steep hillside is smooth ground a tractor works along the contour; gentle land cut with banks often is not, and no slope map tells those apart. Use the green ground for vehicle routes, fence lines and anywhere a tractor has to reach. The colours compare ground within this parcel only.

Which way the land faces
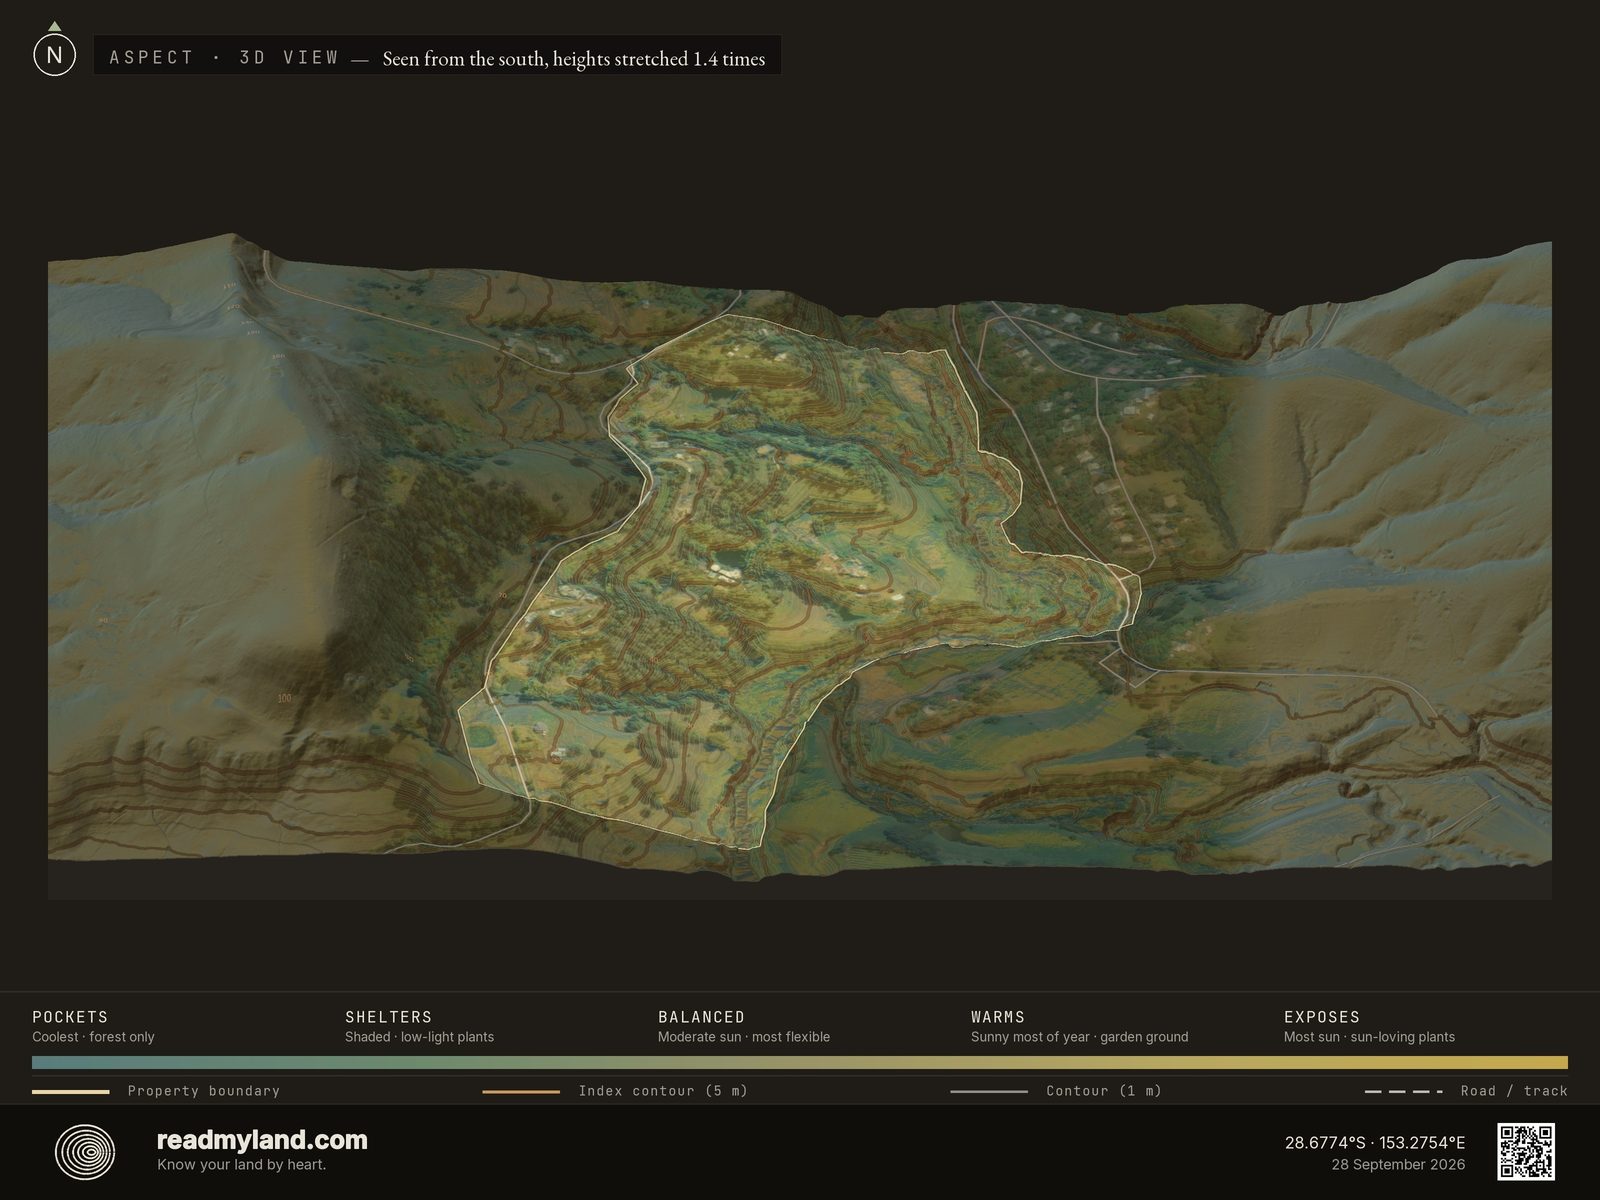
The orientation of each slope: the driver of sunlight. South of the equator the light comes from the north, and the solar score counts a wide arc around it: west through north through east. Even against that generous band, the flat geometry leaves only 43.3% of the parcel sun-facing, so concentrate gardens and any tilted PV on those pockets and let the rest run to pasture and tree crops.

The landform, lit from a low sun
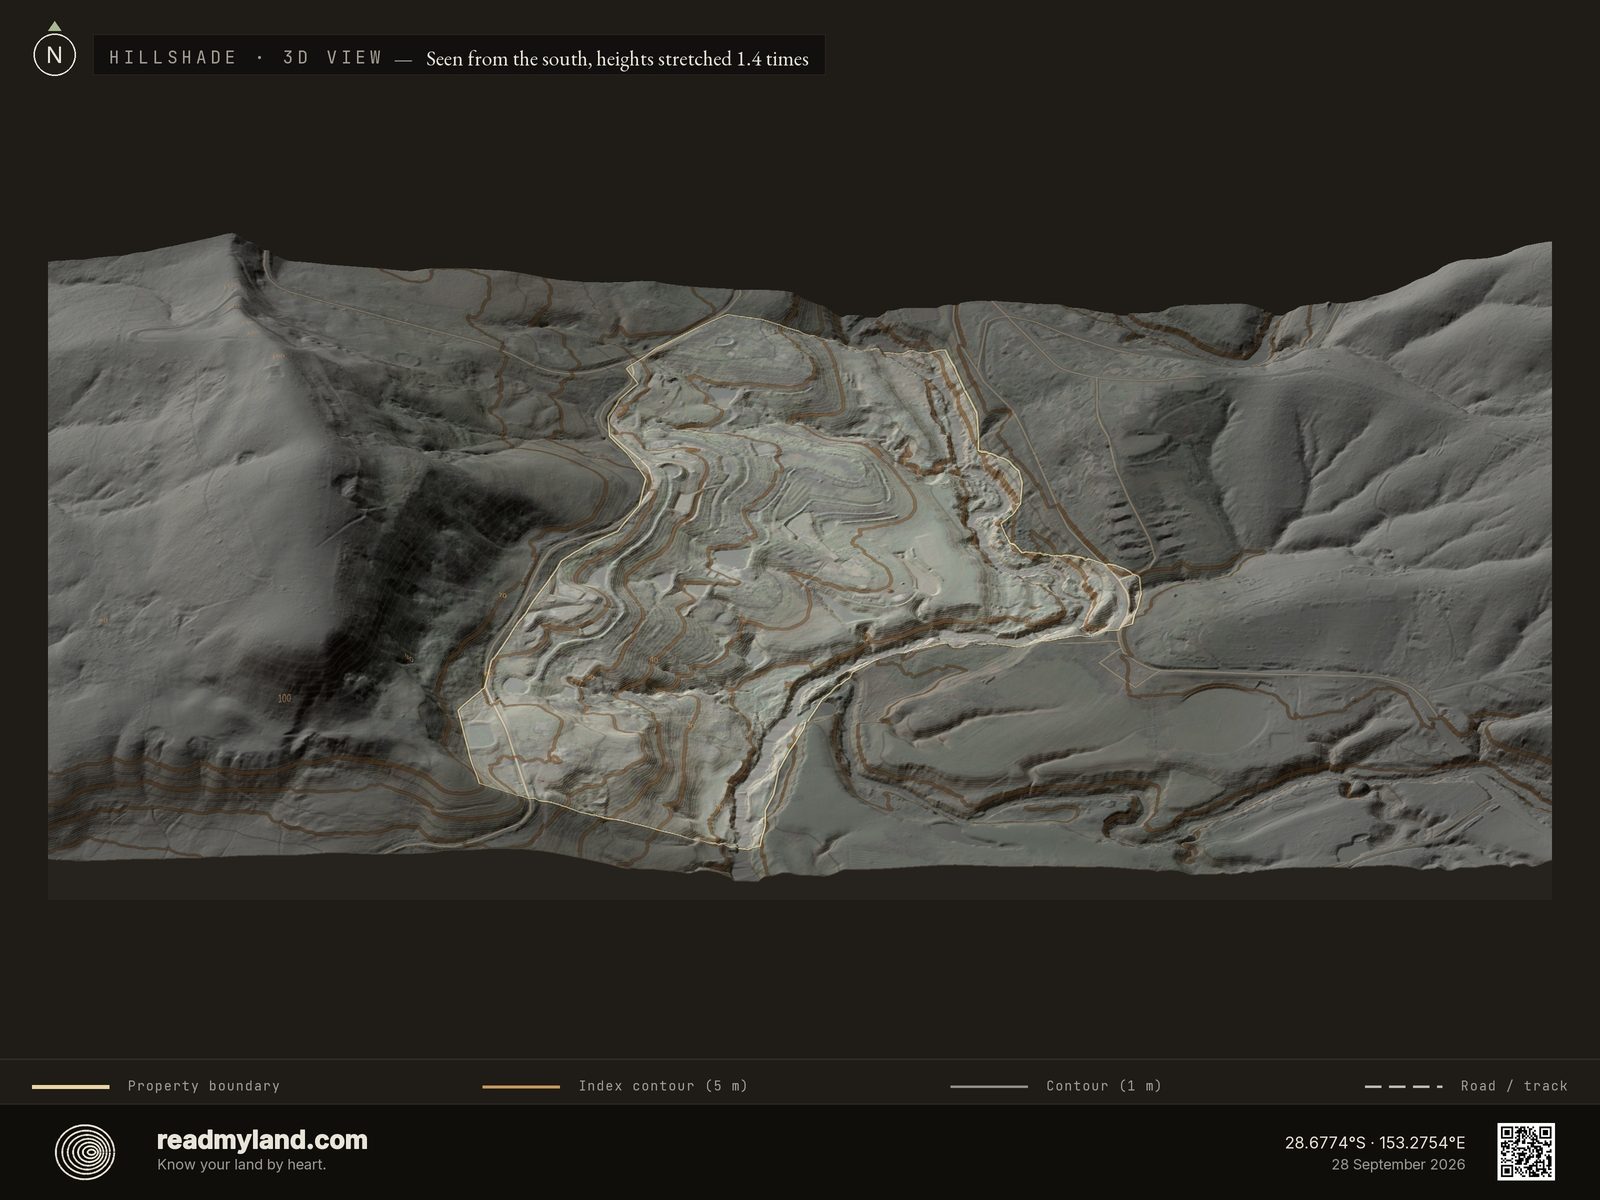
A shaded-relief render of the landform, the satellite imagery faded behind it. Lit low, the farm reads as a steep western flank falling to level creek flats: shadowed upper ground against the higher, part-wooded country to the west, a few soft spurs and hollows mid-parcel, and the bright eastern lobe below. High ground west, water east: the whole design question in one image.

Sun, wind, and shelter in one view
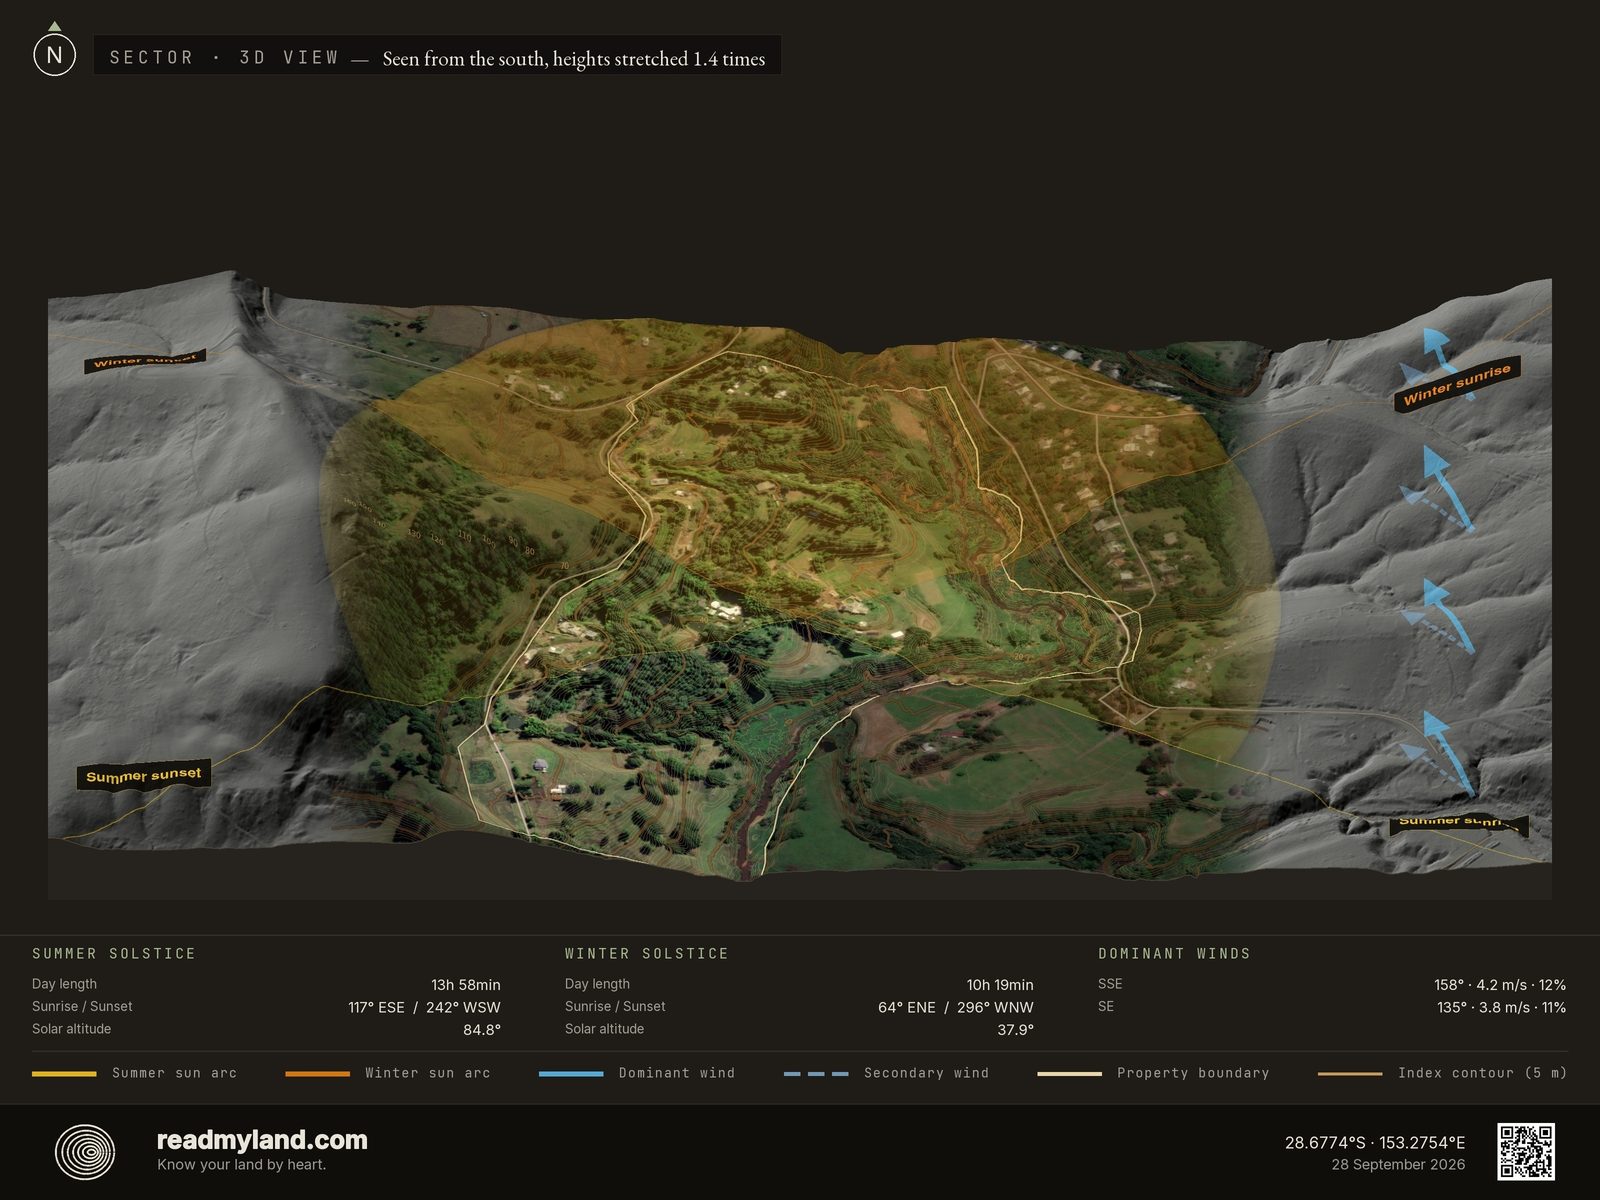
The sun's arcs and the prevailing winds, drawn over the farm, and at 28° south everything is mirrored, which is why the winter sunrise and sunset labels sit at the top of the plate: the low sun swings through the north. Midsummer sun stands at a near-vertical 84.8°, midwinter still reaches 37.9°, and the dominant breezes come out of the south-east, SSE at 4.2 m/s, SE at 3.8 m/s, closer to a sea breeze than a wind problem. Which makes this a sun plate rather than a shelter plate: only 43.3% of the parcel carries a sun-favourable aspect, the wide west-through-north-through-east band the solar score uses, since in the southern hemisphere it is the northerly side that gets the light.

What decides the growing
Rainfall, temperature range, frost-free days, growing degree days, and wind in one place. The 365 frost-free days and 1,062 mm annual rainfall are what unlock year-round subtropical cropping here.
What the land can tell you.
Confidence is a band, not a measurement: each layer is held to the lower of two things — how well its source is curated, and what its resolution can actually resolve at the scale of this parcel. That is why soil and flood both read low here. The soil grid is 90 m and the flood model is a global ~1 km grid: both are the best public data covering this ground, and one flood cell is wider than the whole farm — so read those two rows as regional context, not parcel-level findings. The elevation row is the one that carries the terrain verdict, and it is 1 m LiDAR.
Every row above is the provider this parcel's dossier actually drew from, not a generic list. This analysis is based on the 1 m Richmond River 2023 LiDAR elevation model, satellite imagery, and global soil data. No parcel-scale flood-zone register covers this location, so flood is read from a global ~1 km inundation model plus terrain signals, and a local flood-risk assessment is recommended. This does not replace parcel-level soil testing, legal due diligence, or factors requiring a site visit. On-site inspection is recommended before purchase or major development. ReadMyLand is not affiliated with Zaytuna Farm or Geoff Lawton; this is an independent analysis of a publicly-known location, published as a worked example.
Now read your own land.
Draw any rural parcel and we read it the same way: the 3D map, the five scores and the verdict’s opening, free. No account. The whole parcel, with the complete written verdict, the PDF dossier and the map files, is one payment of €39.
Read your own land →